Inventory Dashboard
The Inventory Dashboard provides a comprehensive 360-degree view of your stock operations, including sales performance, purchasing metrics, stock levels, product analytics, and intelligent inventory insights powered by the Inventory Copilot.
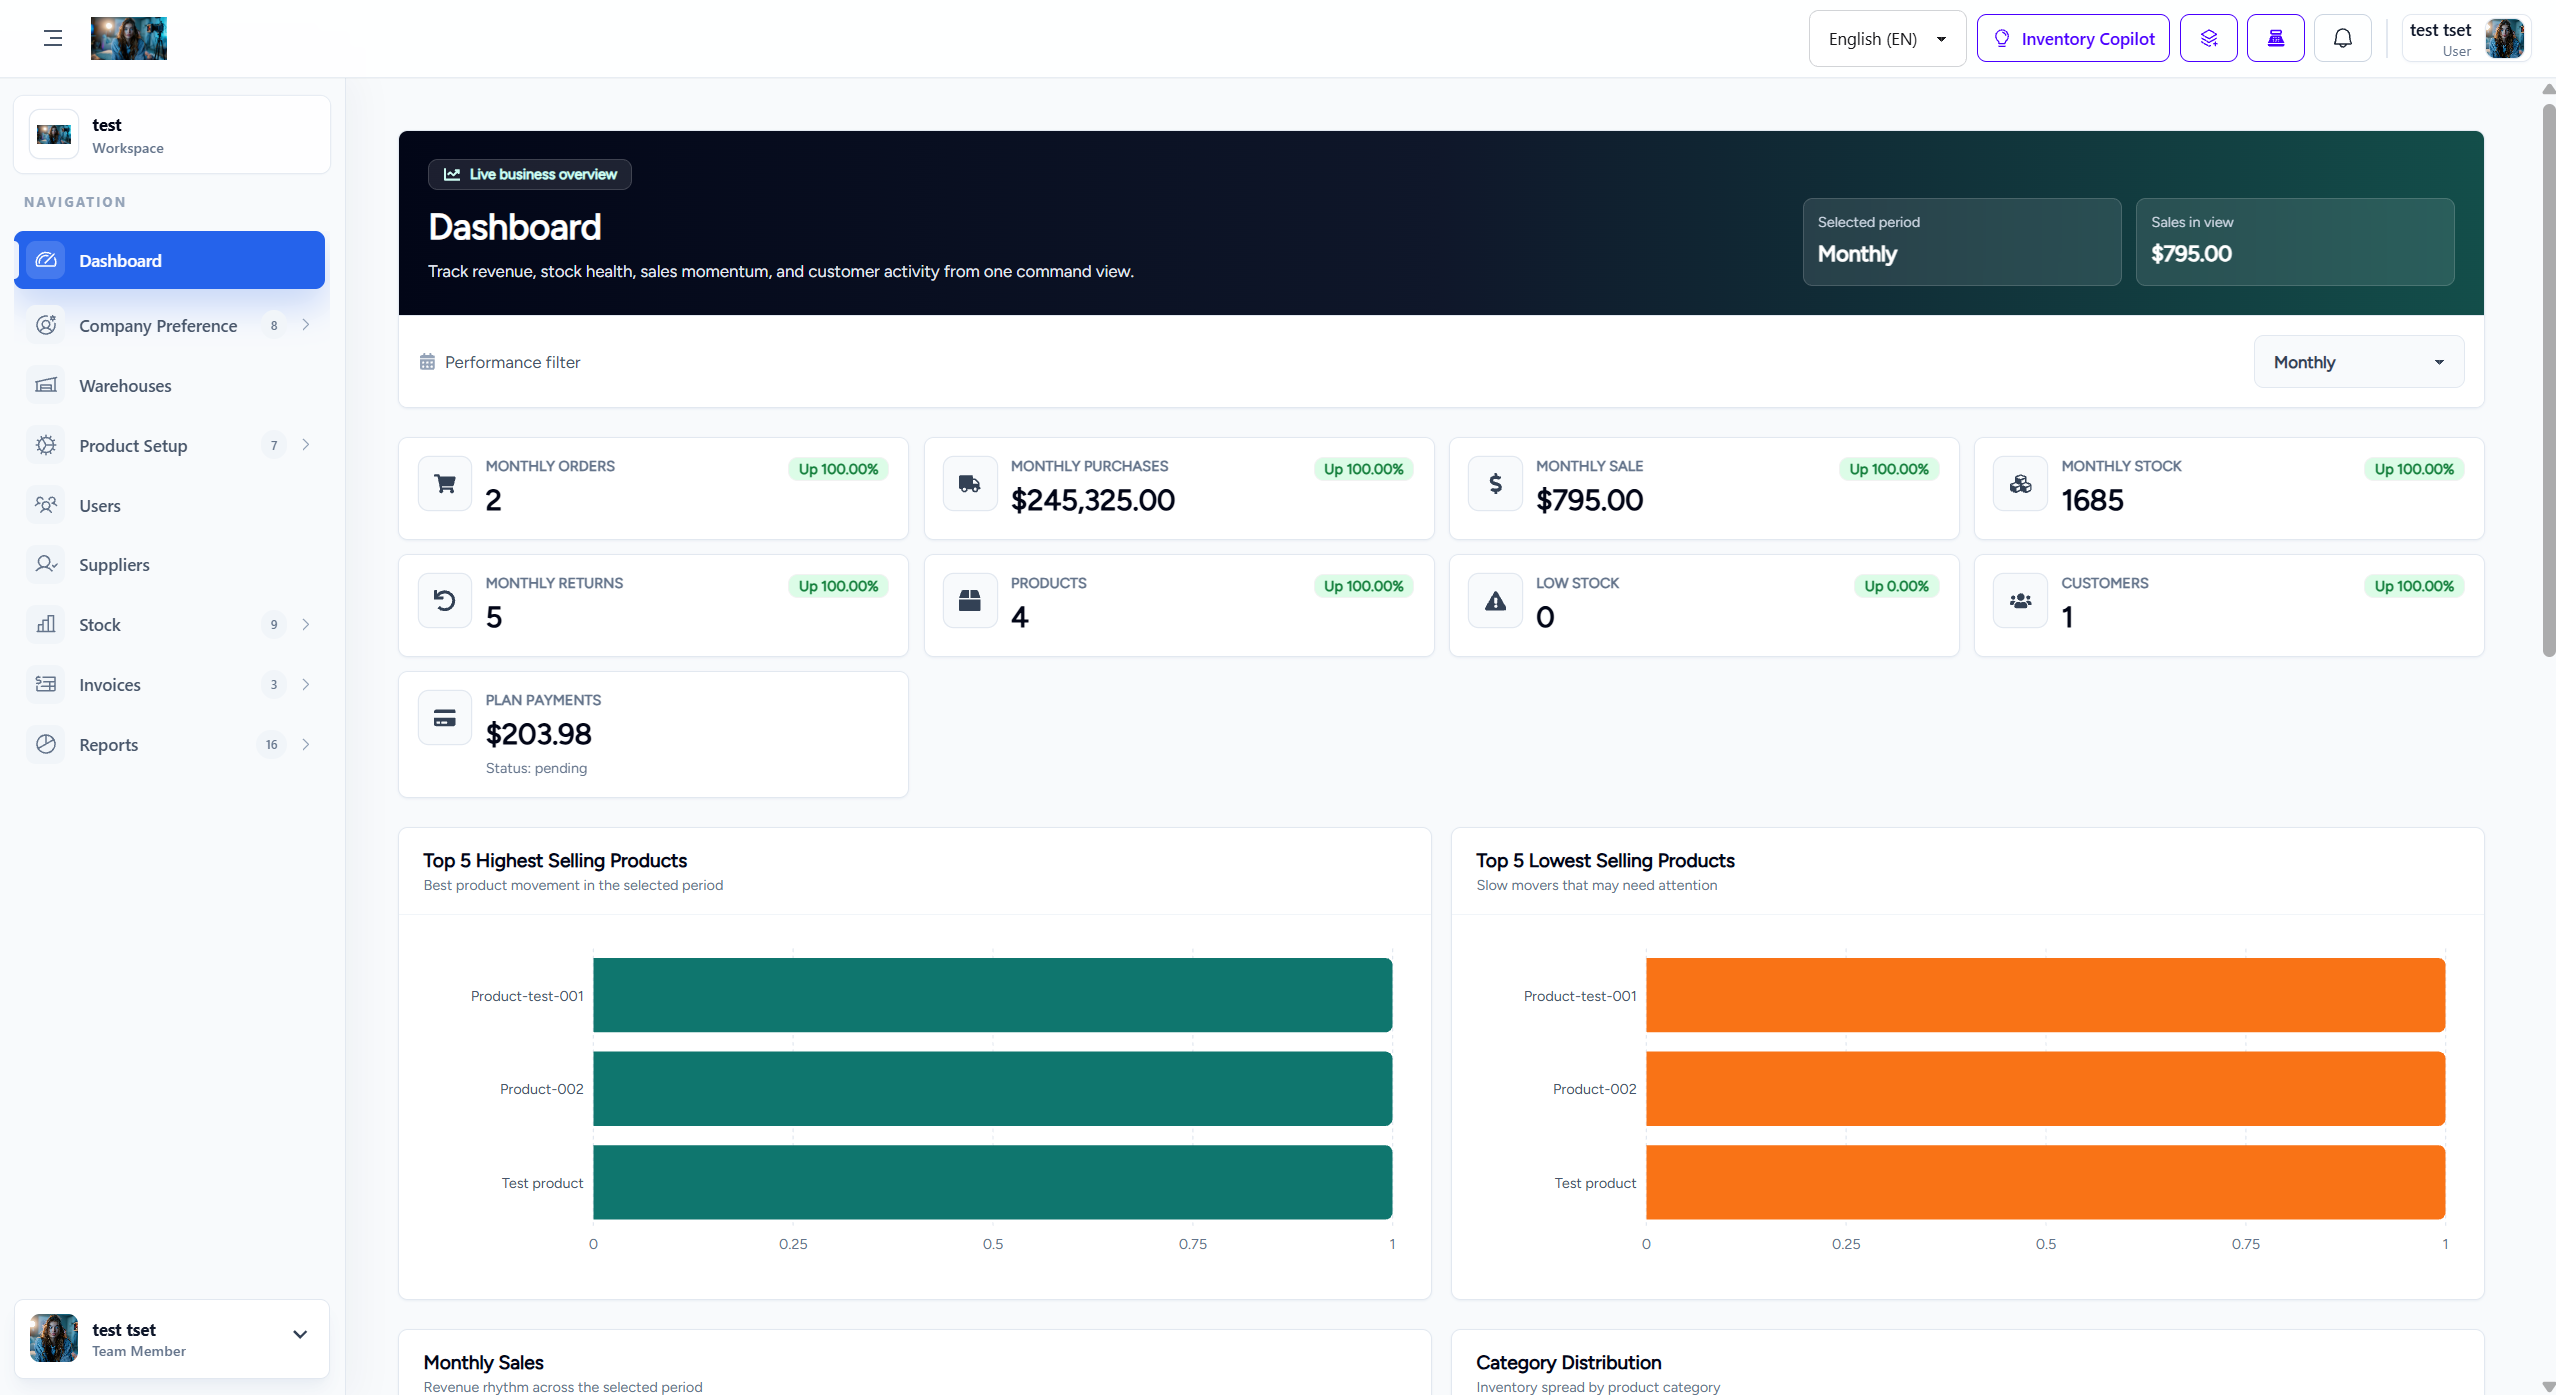
1. Dashboard Header
The top header section provides quick access to essential tools and user information:
- Language Selector: Dropdown to switch between supported languages (e.g., English (EN)).
- Inventory Copilot: AI-powered assistant button that provides intelligent inventory insights and recommendations.
- Notifications: Bell icon displaying unread notifications and alerts.
- Search: Quick search functionality to find products, orders, or other inventory items.
- User Profile: Displays current user information (e.g., "Razzak Milton" with initials "MSR").
- Time Period Filter: "Monthly" dropdown to switch between different time periods for metrics (Daily, Weekly, Monthly, Yearly).
2. Key Metric Counters
The dashboard displays eight critical metric cards that provide instant visibility into your inventory performance:
- Monthly Orders: Total number of orders processed in the current month (e.g., 12 orders, down -36.84%).
- Monthly Purchases: Total purchase value for the current month (e.g., $62,595.00, down -23.53%).
- Monthly Sale: Total sales revenue for the current month (e.g., $639.48, down -14.01%).
- Monthly Stock: Total stock quantity across all products (e.g., 451 units, down -5.25%).
- Monthly Returns: Number of product returns processed (e.g., 8 returns, down -27.27%).
- Products: Total number of products in inventory (e.g., 227 products, up +3,142.86%).
- Low Stock: Number of products with low stock levels requiring attention (e.g., 83 products, up +1,085.71%).
- Customers: Total number of active customers (e.g., 25 customers, up +2,400.00%).
3. Top 5 Highest Selling Products
This bar chart visualizes your best-performing products based on sales volume:
- Warehouse to warehouse: Highest selling product
- Bundle 1: Second highest selling product
- Best product: Third highest selling product
- CASE 2M: Fourth highest selling product
- TV REMOTE: Fifth highest selling product
4. Top 5 Lowest Selling Products
This bar chart identifies products that need attention due to low sales performance:
- TEXT: Lowest selling product
- HEADPHON: Second lowest selling product
- CABLE 1M: Third lowest selling product
- HEADPHON: Fourth lowest selling product
- ADAPTOR INTERNATIONAL: Fifth lowest selling product
5. Monthly Sales Chart
This bar chart displays sales distribution across the days of the month (01 to 31), helping identify sales patterns and peak periods:
- Peak Days: Notable sales peaks around day 12 and day 24.
- Trend Analysis: Visual representation of daily sales performance to identify seasonal patterns.
- Period Comparison: Compare current month performance with previous periods.
6. Category Distribution
This pie chart shows the distribution of products across different categories:
- ACCESSORIS: 40 products
- MOBILE: 39 products
- CABLE: 5 products
- Test: 0 products
- NOKIA: 11 products
- HEADPHONE: 32 products
- SAMSUNG: 30 products
- POWER NANK: 11 products
- Occasion iphone: 5 products
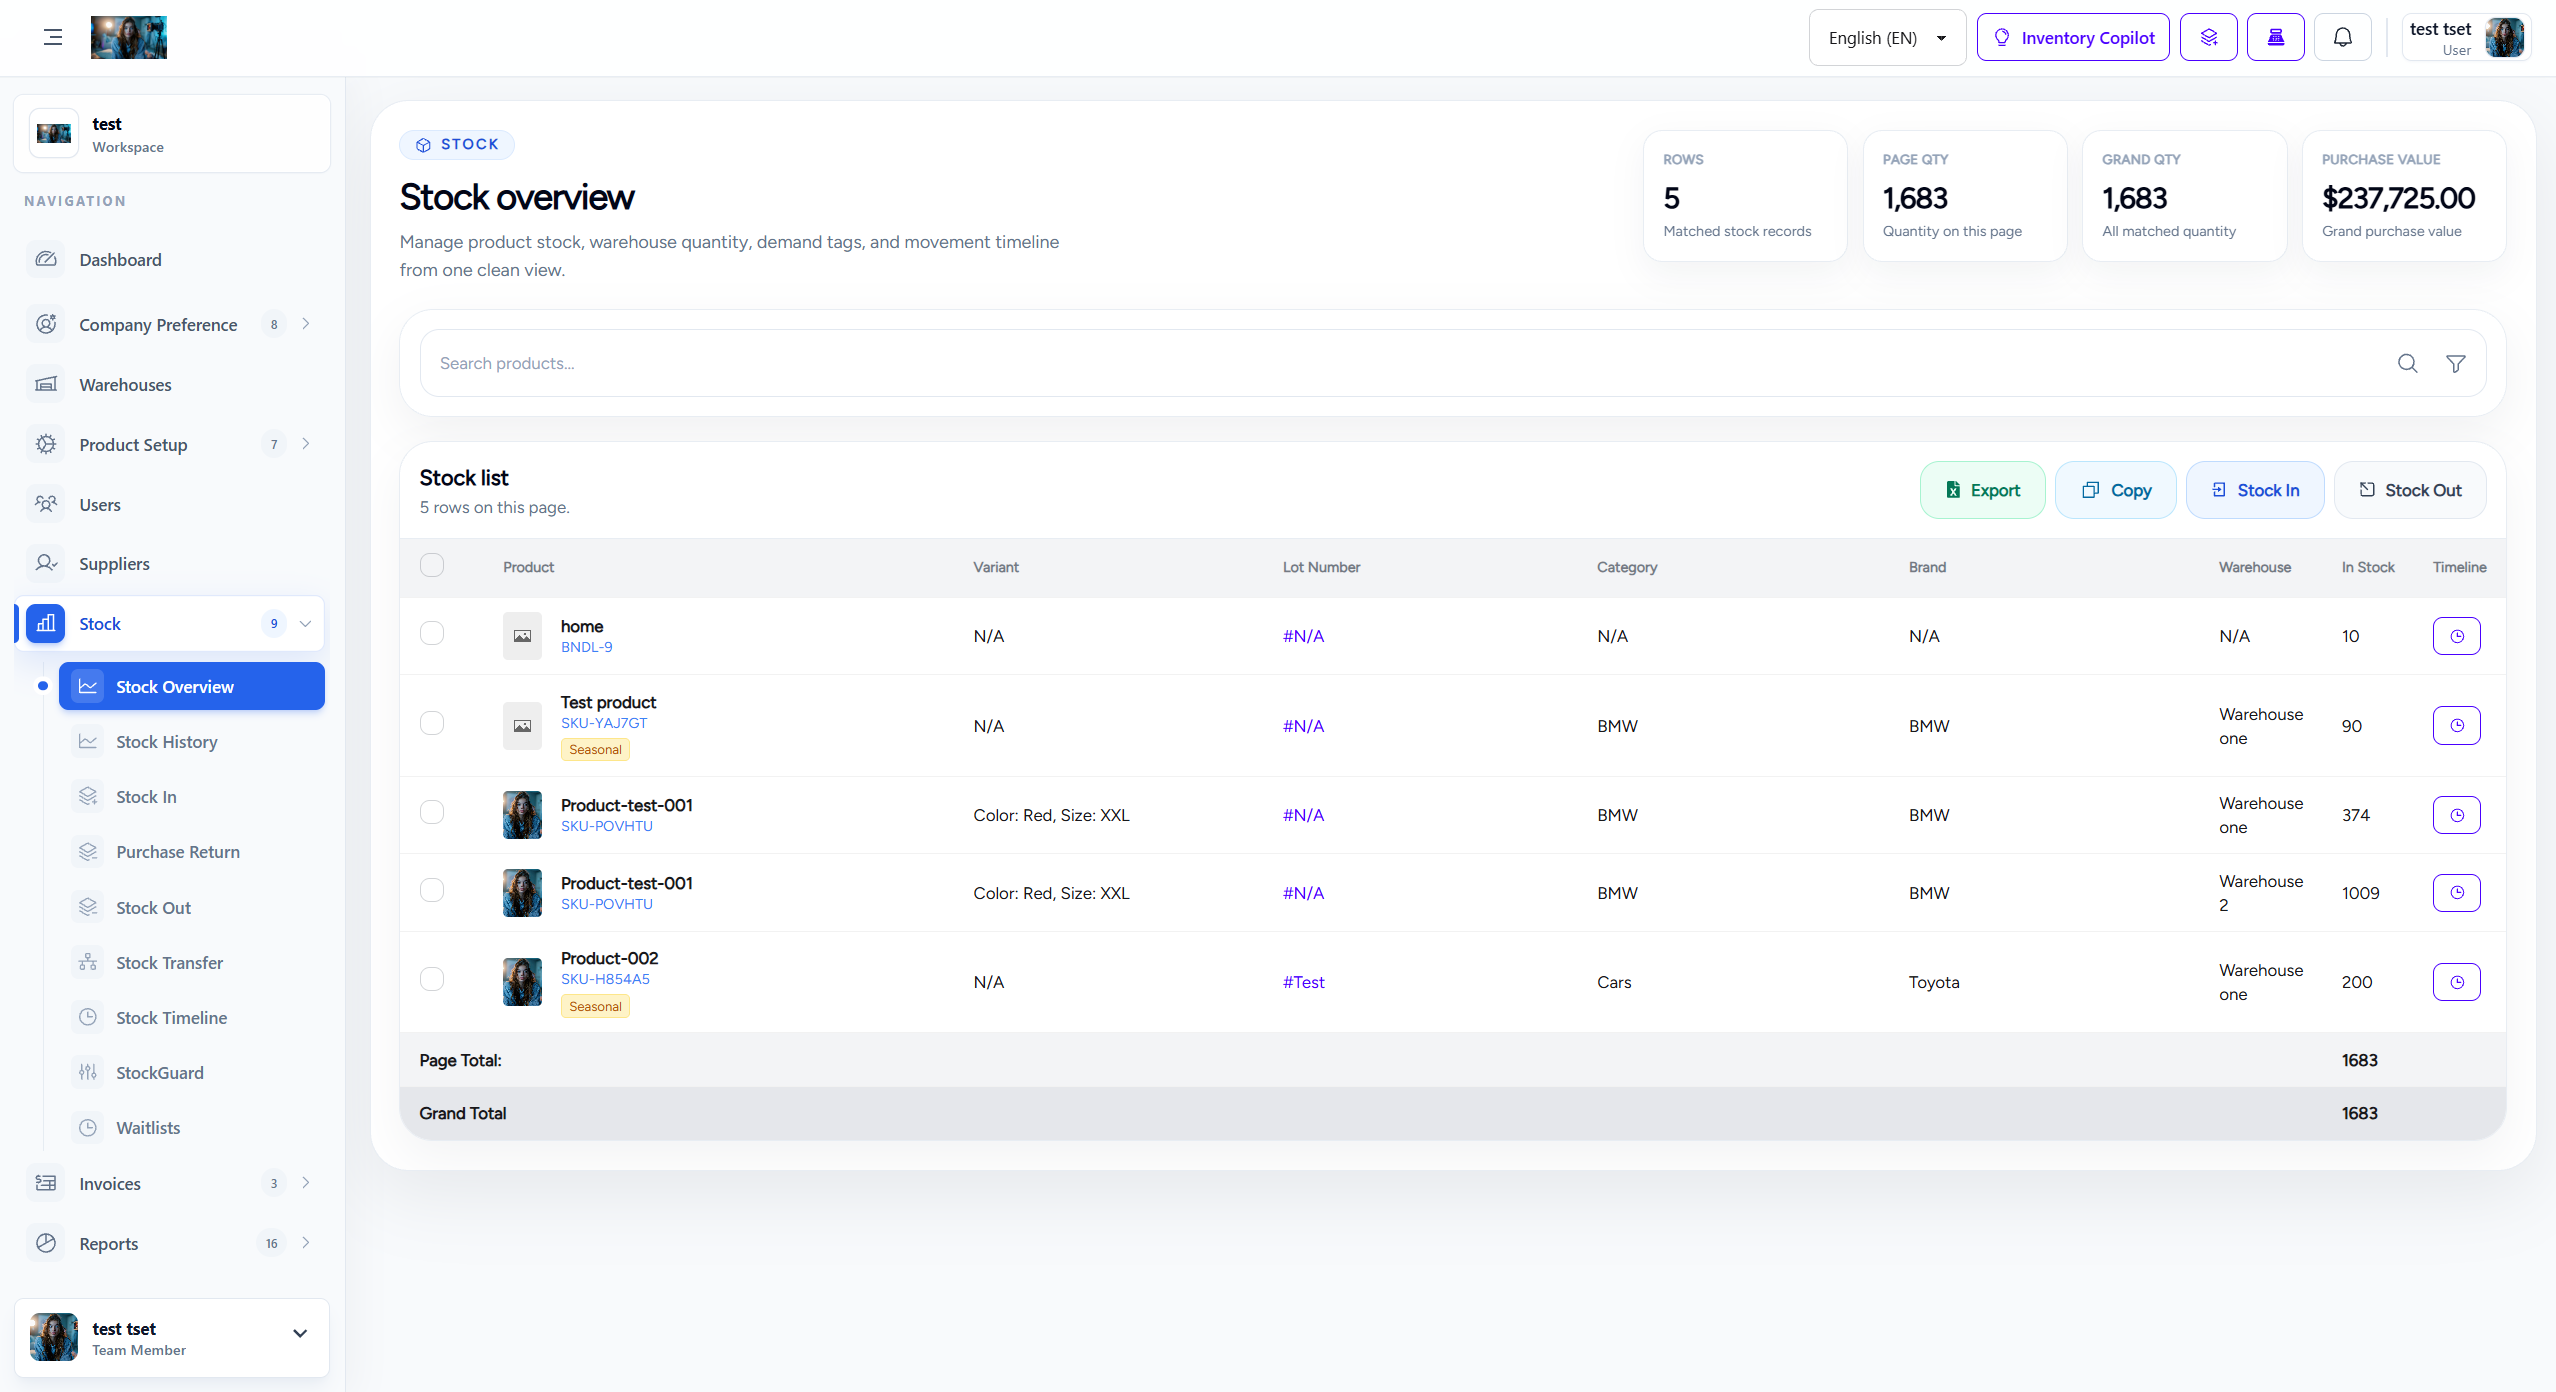
7. Stock Time Value (STV) Table
The Stock Time Value table provides intelligent insights into aging inventory with actionable recommendations:
| Column | Description |
|---|---|
| Product | Product name and SKU (e.g., A14 4/128 - SKU: LJ100M) |
| Lot | Lot number or batch identifier (N/A if not applicable) |
| Age | Number of days the product has been in inventory (e.g., 175 days) |
| Qty | Current quantity in stock (e.g., 60 units) |
| STV | Stock Time Value category (e.g., Day 61+: indicates aging stock) |
| Suggestion | AI-powered recommendations with action buttons (e.g., "Recommend discount / bundle", "Create discount", "Create bundle") |
Sample STV Data
| Product | Lot | Age | Qty | STV | Suggestion |
|---|---|---|---|---|---|
| A14 4/128 (SKU: LJ100M) | N/A | 175 days | 60 | Day 61+ | Recommend discount / bundle, Create discount, Create bundle |
| A06 4/128 SG (SKU: MNYY7) | N/A | 174 days | 6 | Day 61+ | Recommend discount / bundle, Create discount, Create bundle |
| A16 50 (SKU: RYK6W) | N/A | 174 days | 6 | Day 61+ | Recommend discount / bundle, Create discount, Create bundle |
| A525 6/128 (SKU: ALEYZ) | N/A | 174 days | 16 | Day 61+ | Recommend discount / bundle, Create discount, Create bundle |
| A55 SUMSANG (SKU: 03243N) | N/A | 174 days | 9 | Day 61+ | Recommend discount / bundle, Create discount, Create bundle |
| A56 8.128 (SKU: JXJ8F) | N/A | 174 days | 6 | Day 61+ | Recommend discount / bundle, Create discount, Create bundle |
| S24 8.128 (SKU: OFKFZ) | N/A | 174 days | 3 | Day 61+ | Recommend discount / bundle, Create discount, Create bundle |
| S24 8.256 (SKU: QY78R) | N/A | 174 days | 3 | Day 61+ | Recommend discount / bundle, Create discount, Create bundle |
STV Categories
The Stock Time Value system categorizes inventory based on age:
- Day 0-30: Fresh inventory, optimal for regular sales
- Day 31-60: Aging inventory, monitor for movement
- Day 61+: Critical aging stock, requires immediate action (discounts, bundles, or promotions)
8. Inventory Copilot Integration
The Inventory Copilot feature provides AI-powered insights and recommendations directly within the dashboard:
- Smart Recommendations: AI analyzes inventory data and suggests optimal actions for aging stock.
- Discount Suggestions: Automatic recommendations for discount percentages based on product age and category.
- Bundle Creation: Suggestions for product bundles to move slow-moving inventory.
- Predictive Analytics: Forecast future stock needs based on historical sales patterns.
9. Time Period Filtering
The "Monthly" dropdown allows you to switch between different time periods for all metrics:
- Daily: View today's performance metrics
- Weekly: View current week's performance
- Monthly: View current month's performance (default)
- Yearly: View annual performance metrics
10. Responsive Design
The inventory dashboard is fully responsive and adapts to different screen sizes:
- Desktop: Full dashboard with all charts and tables visible
- Tablet: Optimized layout with stacked metric cards
- Mobile: Simplified view with essential metrics and collapsible sections